




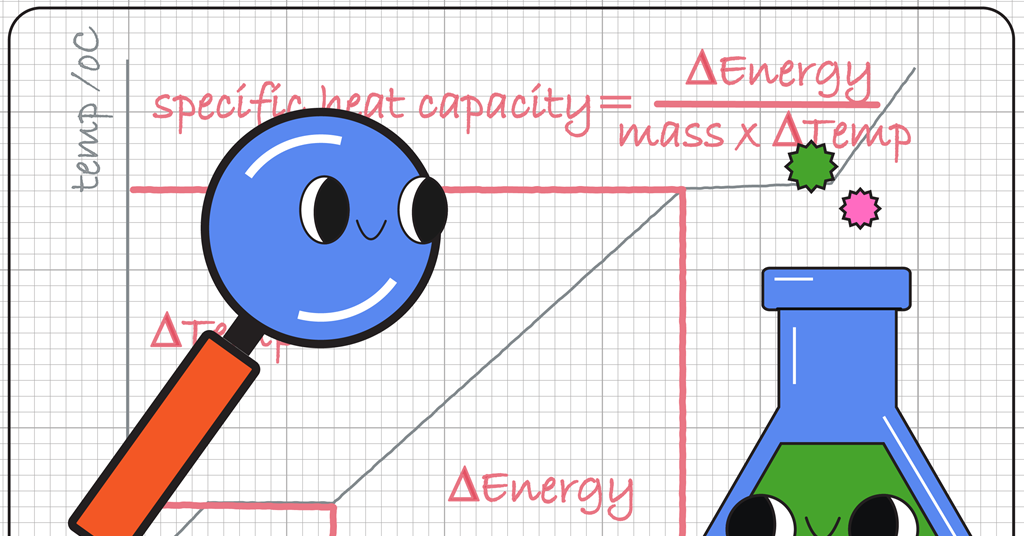
Effective teaching of graph skills is essential for science students, encompassing abilities such as plotting, interpreting, and relating graphs to real-world contexts. While students learn graph skills in mathematics, the application and interpretation of graphs differ significantly in scientific disciplines, prompting educators to develop strategies tailored to their subject areas.
Teaching graph skills in science requires an understanding of the unique vocabulary and methodologies relevant to the field. For instance, in science, the term “correlation” can denote any data relationship, whereas, in mathematics, a positive correlation typically passes through the origin at (0,0), and a negative correlation indicates a downward slope. This distinction highlights the importance of clarity in teaching these concepts, ensuring students appreciate the varied contexts of graph interpretation.
A notable tool that can enhance graph teaching is the modern visualiser. Since adopting bendy-necked Hue HD webcams in science labs in 2011, educators have reported transformative effects on classroom engagement. Visualisers allow instructors to demonstrate graphing techniques—such as selecting appropriate axes, accurately plotting points, and analyzing slopes—while explaining their decision-making process. This approach has shown to improve the quality of students’ work when they attempt similar tasks independently.
Using visualisers in the classroom also facilitates effective discussions on student-created graphs. Instructors can present student graphs that are strong yet contain minor flaws for class evaluation. By encouraging students to identify areas for improvement, educators can foster a collaborative learning environment that emphasizes critical analysis and constructive feedback.
Annotation of graphs further aids comprehension. After students complete their graphs, educators can use good examples to illustrate essential points, such as calculations or connections to original concepts. Suggestions for annotations include indicating key data changes, adding diagrams, or marking significant areas of the graph. These enhancements not only bolster understanding but also help students retain information longer.
In teaching oracy skills, educators can enhance graphed discussions by encouraging precise language. For example, students should avoid vague terms like “it increases,” opting instead for specific phrases, such as “the temperature increases.” Moreover, differentiating between “describe” and “explain” during graphing exercises can strengthen students’ analytical abilities. Descriptive tasks should focus on the data itself, while explanatory tasks should connect the data to underlying scientific theories and principles.
Science educators are encouraged to engage in collaborative discussions within their departments to refine the approach to teaching graph skills. Establishing a common understanding of the purpose of graphs in science will help determine the most effective teaching methods for each graphing skill required in the curriculum.
